A new method to predict species establishment and invasion

Understanding which species are going to establish within a given community (i.e. invasion) is one of the most fundamental pursuits in ecology. In today’s era of global change, this is especially important given the threat of exotic species to native biodiversity. Many hypotheses have been developed in attempts to answer this question, but two predominate. The first is that newly establishing species need to be similar enough to the species at the site to survive the environmental conditions at that site, but dissimilar enough to avoid strong competition with the resident species for the limited available resources (i.e. Darwin’s naturalization hypothesis). The second hypothesis is largely an extension of the first. It predicts that diverse plant communities should be more resistant to invasion because most of the available resources will already be in use due to the larger number of, presumably functionally distinct, species. However, there are flaws in these hypotheses that limit their applicability.

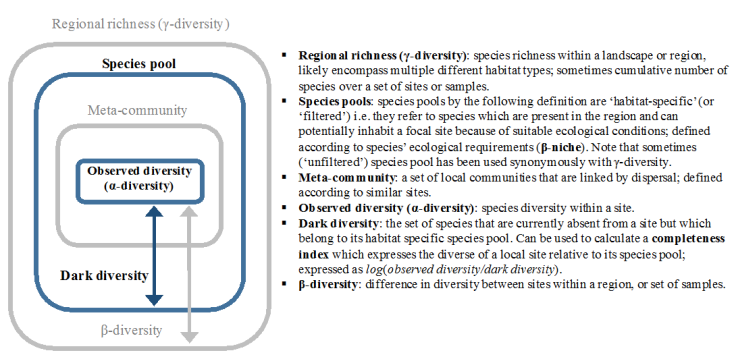
The first major flaw is that the species found at a given site are not entirely the product of interactions among those species: they are also influenced by the regional processes and environmental filtering which combine to shape the species pool for that site (Fig. 1). These processes also have their own effects on invasion. Sites that can support a greater number of species may also support a greater number of invaders (Fig. 1). Consequently, sites that are more diverse due to a larger species pool may also be more readily invaded, complicating any use of local diversity as an indicator of potential biotic resistance. However, if we make local richness proportional to the size of the species pool using the community completeness index (Fig. 1), we may find a more consistent relationship between diversity and invasion.

fig1a
Fig. 1. The multiple filters acting on community assembly and their influence on invasion.

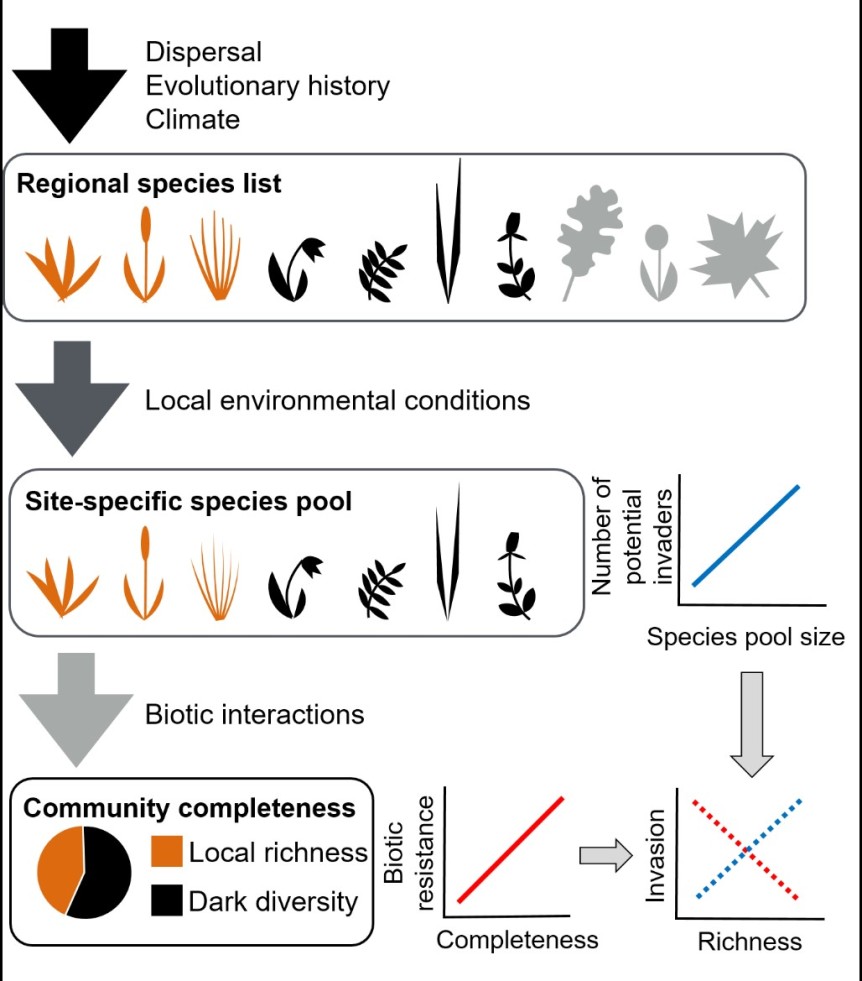
Using a large experiment, we tested this hypothesis by adding both native and exotic species to sites distributed throughout southern Estonia (Bennett et al. 2016 Ecology Letters). We found that by accounting for the size of the site-specific species pool and community completeness, we were better able to explain the variation in invasion than by using local richness alone. Interestingly, species pool size was not always a positive indicator of invasion rates. For exotic species, a larger species pool sometimes resulted in greater biotic resistance. A larger species pool may contain a larger number of strong competitors by random chance alone. However, if competition trades off with dispersal abilities, as it sometimes does, then species pools that remain small due to limited dispersal may be less likely to contain any species that can resist the invader.

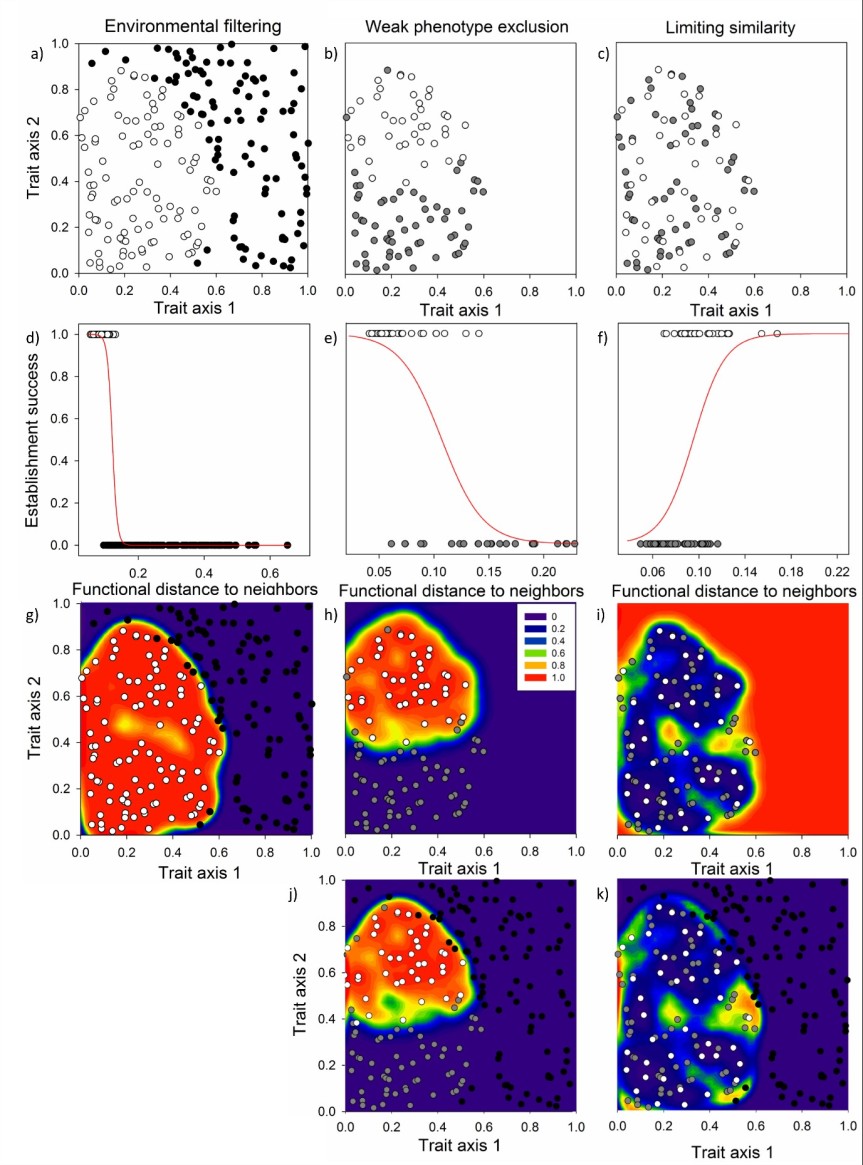
The previous result highlights the importance of understanding the characteristics of the species in different species pools for predicting invasion. Darwin’s naturalization hypothesis attempts to do so, by comparing the characteristics of the potential invader to the resident community. However, this approach does not consider species pool effects on local diversity. Further, it is based on a flawed premise, as competition is not necessarily strongest between the most similar species. Instead competition will depend on the underlying assembly dynamics within the community. In a recent paper (Bennett and Pärtel 2017 Ecology and Evolution), we developed a new method that models environmental and biotic filtering by comparing species across multiple components of the regional species list (Fig. 2).

fig2
Fig. 2. The comparisons used to model community assembly.

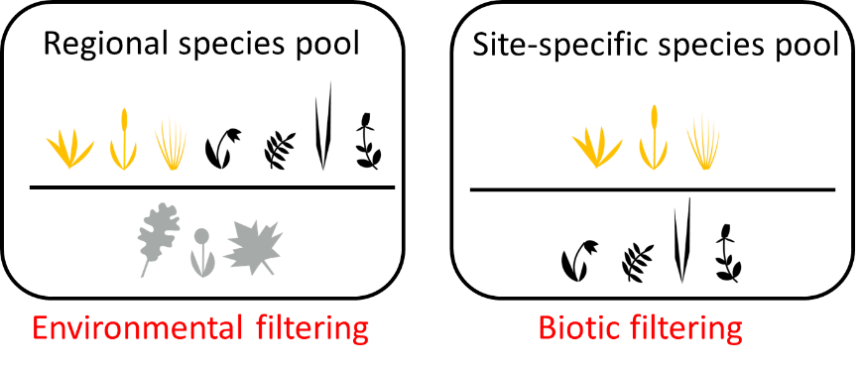
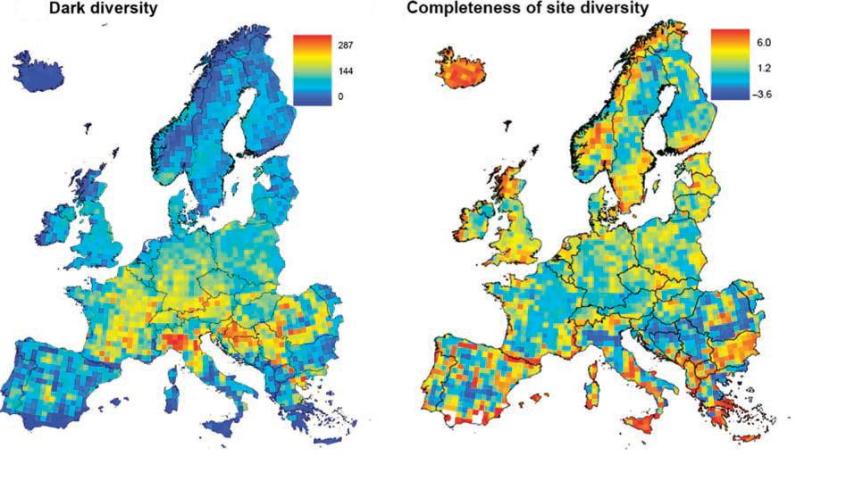
We measure the similarity among species within the site-specific pool relative to the similarity between the site-specific pool and the remainder of the regional species list to model environmental filtering. Similarly, we compare local diversity to the species from the site-specific species pool that are currently absent (dark diversity) to model biotic filtering. Using these models, and the similarity between the invader and these two components of diversity, we can then predict which invaders should establish (Fig. 3). When we tested the method using data from experiments that added seed to Estonian grasslands, we were able to predict approximately 50% of establishment from seed – a very impressive result. This result was based on only native species, but we are working to test the model using exotic species as well.

fig1
Fig. 3. A graphical reprentation of the method predicting inasion by modelling community assembly.

These two papers provide strong evidence that species pools need to be considered when trying to understand and predict invasion. Further, they also indicate a strong need to re-evaluate many of the hypotheses in invasion biology in the light of current knowledge on community assembly.

Bennett, J.A., Riibak, K., Kook, E., Reier, Ü., Tamme, R., Guillermo Bueno, C. & Pärtel, M. (2016) Species pools, community completeness and invasion: disentangling diversity effects on the establishment of native and alien species. Ecology Letters, 19, 1496-1505.

Bennett J.A., Pärtel M. (2017) Predicting species establishment using absent species and functional neighborhoods. Ecology and Evolution7, 22232237

Estimating dark diversity and its application for nature conservation

by Rob

Absent species fall broadly into two groups: those that have an ecological affinity to prevailing abiotic conditions at a focal site, and those that do not. The former, despite the lack of established populations, are species with a reasonable probability of occurrence, and belong to a ‘focal habitat’s dark diversity. But how can dark diversity species be quantified?

New research published from the macroecology workgroup at the University of Tartu, Estonia specifically addressed this question. The research, led by Dr Rob Lewis, a former post doctoral researcher of the workgroup states that “while dark diversity cannot be directly measured, it can be estimated using readily available data and with reasonable accuracy”.

Machair (1)
How many species could be absent from this meadow? Photo: “Wildflowers on a machair on Berneray” by Jon Thomson (Flickr:Machair) [CC BY 2.0]

Published in “Methods in Ecology and Evolution” earlier this year, the work demonstrates how species co-occurrence patterns provide valuable information, for identifying absent species. Through use of spatially nested vegetation data, one covering grassland communities in Scotland and another focused on forest communities in Switzerland, authors R.J. Lewis, R. Szava-Kovats and M. Pärtel demonstrate how quantifying patterns of association between species over space helps to gauge the likelihood of a given species co-existing with another, and vice versa. An absent species with a high likelihood of co-existing among observed species in a community can therefore be identified as belonging to that community’s dark diversity with reasonable accuracy.

Quantifying and understanding patterns of dark diversity can provide valuable information and holds particular relevance for addressing key nature conservation challenges. Dr Lewis’s latest work highlights exactly this, discussing how the dark diversity concept can be utilized to address fundamental challenges faced by conservationists. Here, authors state “there are many reasons to expect an understanding of dark diversity to contribute to our understanding of fundamental ecological processes governing biological diversity. However, to what extent is broadly unknown.”

joonis
Conceptual diagram illustrating the hierarchical structure of following ecological concepts: species pools, alpha (a), beta (b) and gamma (g) diversity, the meta-community and dark diversity.

This work, which developed from a workshop discussion between Estonian and Czech-based ecologists discusses in depth, the potential benefits resulting from utilizing the dark diversity concept (together with existing ecological metrics, concepts and conservation tools) to facilitate 1) habitat prioritization, 2) habitat restoration and 3) the management and mitigation of ecological invasions.

Given the dark diversity can be reasonably well estimated from extant data as demonstrated in earlier works introduced above, in this conservation applied addition to the dark diversity literature, authors advocate the use of dark diversity concept for nature conservation. Implemented more widely, and used to bring together additional ecological information and techniques to describe local study systems, yet simultaneously complementing existing ecological approaches and concepts (e.g. metacommunity dynamics) authors shed light on the dark diversity concept as an informative and complementary biodiversity metric. The work is published in the Journal ‘Conservation Biology’ and can be read here.

Is there a global unimodal relationship between species richness and productivity?

by Robert

Ecology is certainly no stranger to polarising scientific debates, some of which endure for decades.  One such ongoing debate in the botanical community centres on the existence (or not) of a global unimodal relationship between species richness and productivity.  Adherents to the unimodal relationship maintain an eventual decline in richness with increasing productivity, the result of domination by a few highly competitive species.  A recent article in Science, co-authored by some of our colleagues in the Plant Ecology Laboratory, launched another salvo into the debate with evidence a global unimodal relationship between productivity and plant species richness.  In short, the researchers examined the relationship of species richness and productivity (live and total biomass) at different spatial scales in a set of 30 sites across the globe and maintaining a fixed sampling protocol.  The result:  the unimodal relationship is alive and well.  Case closed, right?

Not quite.  A challenge was raised in the form of a rebuttal by Lauri Laanisto (himself a local colleague at the Estonian University of Life Sciences) and Michael J. Hutchings (University of Sussex, UK).  They argue that a strong relationship exists between species richness at the plot level and its corresponding local species pool and that the unimodal relationship is no longer valid once the effect of local species pool is taken into account.  This rebuttal was met by a response, co-authored by our own Meelis Pärtel.  The rebuttal by Laanisto and Hutchings relies in part on their estimate of the relationship between plot species richness and local species pool (for our purposes we can also use measures of ‘local and regional richness’ or ‘alpha- and gamma-diversity’).  Indeed, the estimation of these kinds of relationships is the subject of what has been another long-term ecological debate!

Laanisto and Hutchings calculated the relationship using raw values of local richness and species pool.  A regression analysis of this sort is, however, fraught with difficulty simply because of the mathematical constraint that plot richness cannot exceed the size of the local species pool.  As a result, the “working space” for this regression is not the unconstrained Euclidean space that the bulk of our statistical methods assume, but a strange wedge-shaped region with an apex at the origin.


Figure1_oikos
Figure from Szava-Kovats et al., 2011: 

Laanisto and Hutchings provide an r2 value of 0.74 to describe the strength of the relationship, but how much confidence can we have in this strength?  And is it appropriate to compare this r2 value with those generated by other regression models?  The answers are not encouraging.  Simply placing random data points inside this wedge will result in a positive correlation.  Inquisitive readers are encouraged to try this for themselves:  place 157 random points inside the wedge with a local species pool ranging from 1 to about 110 and calculate the correlation (my trial resulted in an impressive – and statistically significant! – r2 = 0.45).  In fact, it would be a very strange situation indeed to find no significant correlation given such a substantial range of local species pool.

We have examined this statistical dilemma in the previous years and developed a model to overcome this cumbersome constraint.  The trick is to transform the response variable (in this case plot richness) into a logistic expression based on the local species pool, i.e. ln (plot richness/(local species pool-plot richness)).  Similar functions can be expressed as ln(local richness/dark diversity) or ln(alpha/additive beta-diversity).  Whatever specific logratio is used, it will now lie in unconstrained Euclidean space, ready for regression analysis.

When the relationship between plot richness and local species pool was calculated using this method, a curved relationship was revealed, suggesting that plot richness increases less as local species pool increases.  This in turn leads to the conclusion that species richness does decline at ever increasing levels of productivity.

IMGP0021
Plant species diversity in low-productivity habitat, such as this alvar grassland in Estonia, is likely more strongly shaped by species pool size than biotic interactions. However, in productive habitats, effect of species pool size decreases and competition starts to play important role in determining the diversity in local scales.


Dark diversity mapped at the European scale

by Argo & Meelis

Mapping biodiversity at large-scales has a long history and is needed to address theoretical issues on species evolution, macroecology, and biogeography, or to help prioritize conservation efforts. Traditionally, observed species have been used to investigate large scale diversity patterns. However, raw values of observed species richness across large spatial extents can be difficult to interpret due to the concurrent variation in regional species pools. If we can estimate the set of absent species that could potentially inhabit a study site, it would add a new important dimension to the study of local diversity patterns across large spatial extents. This set of absent suitable species is called dark diversity, a concept proposed recently by Professor Meelis Pärtel who leads the macroecology workgroup at the University of Tartu, Estonia. In order to shed light on dark diversity, researchers need to know which absent species are present in the surrounding region, which have a reasonable probability to disperse to the study site, and which are able to tolerate the local prevailing environmental conditions. The concept of dark diversity has already gained a lot of attention; in addition to several responses in academic literature, it has also been covered in several blogs (see here and here) and also in Faculty100.

In a paper in the October 2015 issue of Ecography, Argo Ronk, Robert Szava-Kovats and Meelis Pärtel from the macroecology workgroup applied a novel method to quantify European-wide plant dark diversity. They used both geographically limited region and species’ environmental preferences. While delimiting a region is rather straightforward, it is more challenging to find environmental preferences for a large number of species. For this they used a co-occurrence approach; a mathematical analysis of a large data set to find which species often appear together in the same sites, thus requiring the same environmental conditions. If one of these species is present and another is absent, the absent species is likely in dark diversity. Dark diversity allows researchers to study local diversity at a relative scale: how many suitable species are present, how many are absent, in other words, how much of the species pool is realized in each locality. This can be quantified by completeness of site diversity, proposed a few years ago.

The authors used a European-wide plant distribution atlas and found that dark diversity is highest in south Europe, which is in accordance with the well-known latitudinal pattern of observed species richness. However dark diversity was rather low compared to observed species richness. Completeness of site diversity exhibited a scattered pattern across Europe. More complete sites can be found in both northern Europe and southern Europe; central Europe contains mainly moderately complete sites which might be due to intensive land-use causing local extinctions. Compared to dark diversity and observed richness patterns, completeness of site diversity showed no latitudinal gradient. Mountainous areas in Europe (e.g. Scandinavia, Pyrenees) showed high completeness of site diversity, perhaps due to better preserved ecosystems there. In conclusion, better insights can be obtained about local diversity patterns and underlying processes by exploring not only observed but also dark diversity.

ObservedRichness

Dark_Completeness
Figure from Ronk, A., Szava-Kovats, R. & Pärtel, M. (2015) Applying the dark diversity concept to plants at the European scale. Ecography, 38, 1015-1025.